2.2.3.1. Viewing 2-D Data from LRMECS
The IPNS LRMECS instrument stored data in NeXus HDF4 data files. One such example is available from the repository of NeXus data file examples. [1] For this example, we will start with a conversion of that original data file into HDF5 format.
format |
file name |
|---|---|
HDF4 |
lrcs3701.nxs |
HDF5 |
lrcs3701.nx5 |
This dataset contains two histograms with 2-D images (148x750 and 148x32) of 32-bit integers.
First, we use the h5dump tool to investigate the header content of the file
(not showing any of the data).
2.2.3.1.1. Visualize Using h5dump
Here, the output of the command:
h5dump -H lrcs3701.nx5
has been edited to only show the first NXdata group (/Histogram1/data):
LRMECS lrcs3701 data: h5dump output
 1HDF5 "C:\Users\Pete\Documents\eclipse\NeXus\definitions\exampledata\IPNS\LRMECS\lrcs3701.nx5" {
 2GROUP "/Histogram1/data" {
 3   DATASET "data" {
 4      DATATYPE  H5T_STD_I32LE
 5      DATASPACE  SIMPLE { ( 148, 750 ) / ( 148, 750 ) }
 6   }
 7   DATASET "polar_angle" {
 8      DATATYPE  H5T_IEEE_F32LE
 9      DATASPACE  SIMPLE { ( 148 ) / ( 148 ) }
10   }
11   DATASET "time_of_flight" {
12      DATATYPE  H5T_IEEE_F32LE
13      DATASPACE  SIMPLE { ( 751 ) / ( 751 ) }
14   }
15   DATASET "title" {
16      DATATYPE  H5T_STRING {
17            STRSIZE 44;
18            STRPAD H5T_STR_NULLTERM;
19            CSET H5T_CSET_ASCII;
20            CTYPE H5T_C_S1;
21         }
22      DATASPACE  SIMPLE { ( 1 ) / ( 1 ) }
23   }
24}
25}
2.2.3.1.2. Visualize Using HDFview
For many, the simplest way to view the data content
of an HDF5 file is to use the HDFview program
(https://portal.hdfgroup.org/display/HDFVIEW/HDFView)
from The HDF Group. After starting HDFview, the data file
may be loaded by dragging it into the main HDF window.
On opening up to the first NXdata group /Histogram1/data
(as above), and then double-clicking the dataset called: data, we get
our first view of the data.
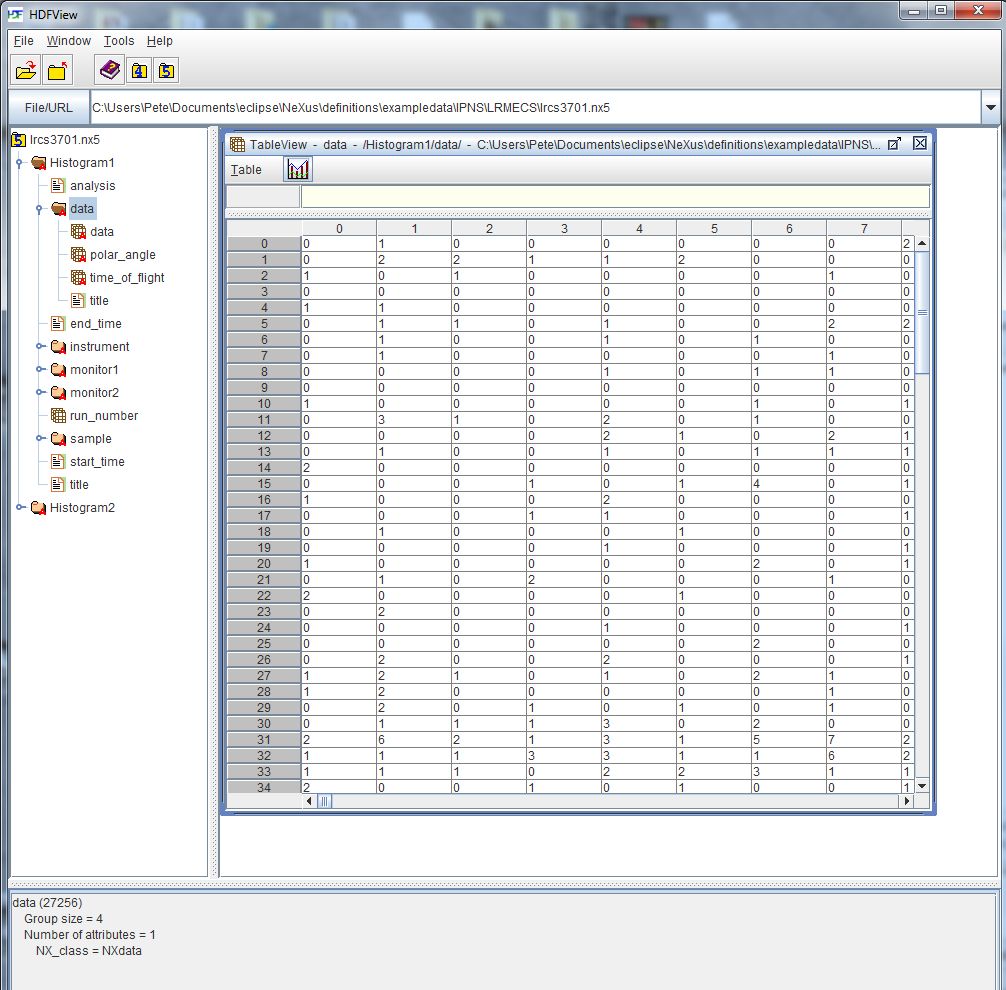
LRMECS lrcs3701 data: HDFview
The data may be represented as an image by accessing the Open As menu from HDFview (on Windows, right click the dataset called data and select the Open As item, consult the HDFview documentation for different platform instructions). Be sure to select the Image radio button, and then (accepting everything else as a default) press the Ok button.
Note
In this image, dark represents low intensity while white represents high intensity.
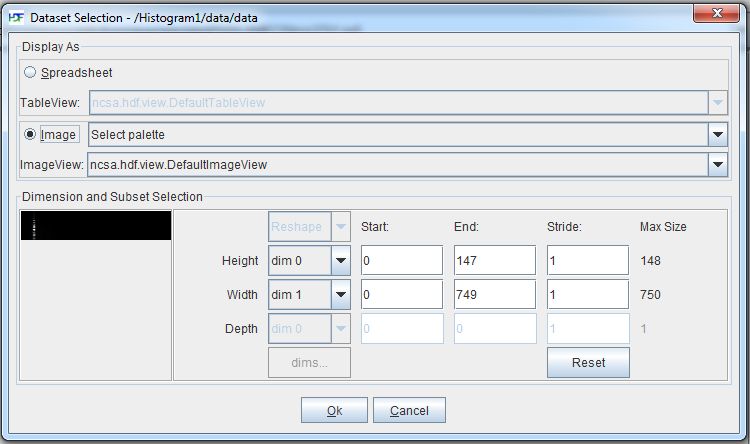
LRMECS lrcs3701 data: HDFview Open As dialog
LRMECS lrcs3701 data: image
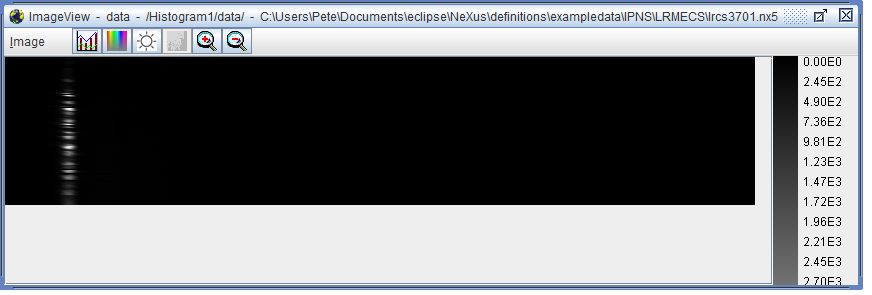
LRMECS lrcs3701 data: HDFview Image
2.2.3.1.3. Visualize Using IgorPro
Another way to visualize this data is to use a commercial package for scientific data visualization and analysis. One such package is IgorPro from http://www.wavemetrics.com
IgorPro provides a browser for HDF5 files that can open our NeXus HDF5 and display the image. Follow the instructions from WaveMetrics to install the HDF5 Browser package: http://www.wavemetrics.com/products/igorpro/dataaccess/hdf5.htm
You may not have to do this step if you have already installed the HDF5 Browser.
IgorPro will tell you if it is not installed properly.
To install the HDF5 Browser, first start IgorPro.
Next, select from the menus and submenus:
Data; Load Waves; Packages; Install HDF5 Package as shown in the next figure.
IgorPro may direct you to perform more activities before you progress from this step.
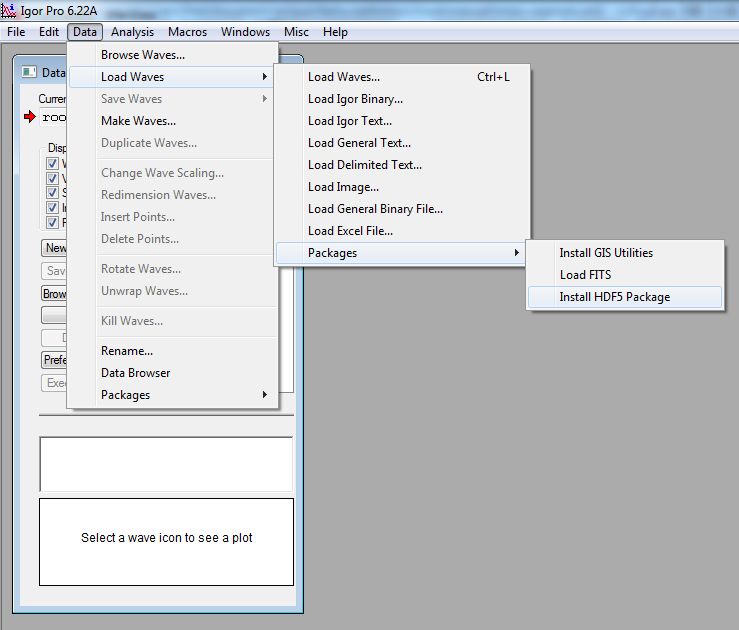
LRMECS lrcs3701 data: IgorPro install HDF5 Browser
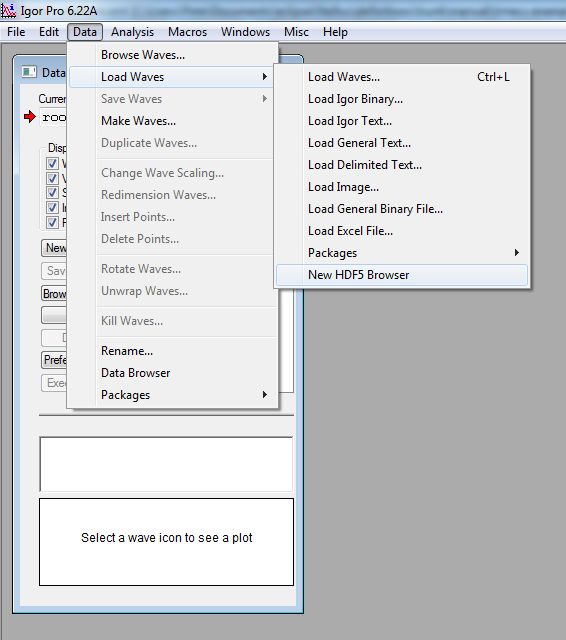
Next, open the HDF5 Browser by selecting from
the menus and submenus:
Data; Load Waves; New HDF5 Browser
as shown in the next figure.
LRMECS lrcs3701 data: IgorPro HDFBrowser dialog
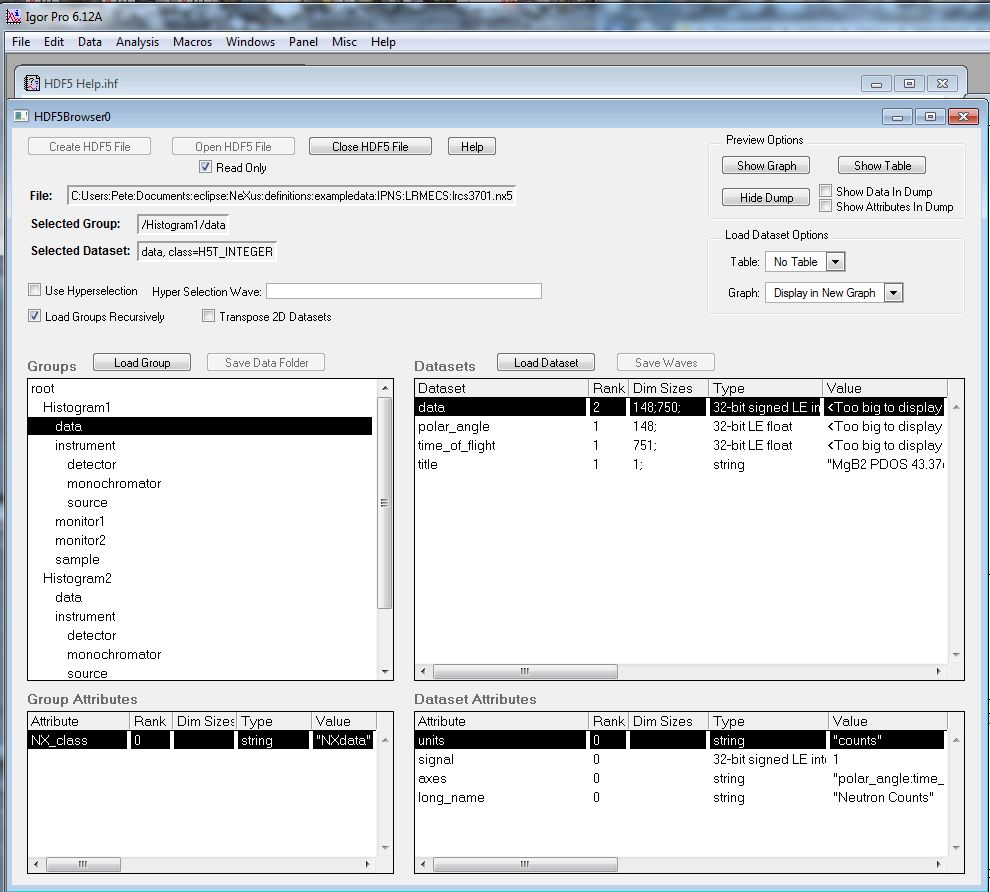
Next, click the Open HDF5 File button and
open the NeXus HDF5 file lrcs3701.nxs. In the lower left Groups
panel, click the data dataset. Also, under the panel
on the right called Load Dataset Options,
choose No Table as shown. Finally, click the
Load Dataset button (in the Datasets group)
to display the image.
Note
In this image, dark represents low intensity while white represents high intensity. The image has been rotated for easier representation in this manual.
LRMECS lrcs3701 data: IgorPro HDFBrowser dialog
LRMECS lrcs3701 data: image

LRMECS lrcs3701 data: IgorPro Image
