Note
Go to the end to download the full example code.
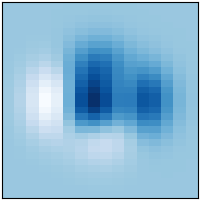
Image
Image on a regular two-dimensional grid.
The x-axis and y-axis define a regular 2D grid. The grid is equally spaced in this example but this is not necessarily the case.
@NX_class = "NXroot"
@default = "scan1"
scan1:
  @NX_class = "NXentry"
  @default = "data"
  data:
    @NX_class = "NXdata"
    @axes = ["y", "x"]
    @signal = "z"
    x: NX_FLOAT64[16]
    y: NX_FLOAT64[30]
    z: NX_FLOAT64[30,16]
Explanation:
@axeshas two values which corresponds to the signal rank of two.zis the default signal to be plotted versusxandy.zhas 30 rows and 16 columns.yspans the first dimension ofzandxthe second.
# Data
import numpy as np

x = np.linspace(-3, 3, 16)
y = np.linspace(-3, 3, 30)

xx, yy = np.meshgrid(x, y)
z = (1 - xx / 2 + xx**5 + yy**3) * np.exp(-(xx**2) - yy**2)

# Plot
import matplotlib.pyplot as plt  # noqa E402

plt.style.use("_mpl-gallery-nogrid")

fig, ax = plt.subplots()

ax.imshow(z, extent=[x[0], x[-1], y[0], y[-1]], origin="lower")

plt.show()
Total running time of the script: (0 minutes 0.022 seconds)
