Parse tabular measurement data with the tabular parser
In this tutorial, we transform a tabular measurement file into a structured NOMAD entry using NOMAD's tabular parser. We build and configure a YAML-based parser that extracts data from a .csv and .xlsx file, stores them as an entry, and enables visualization in NOMAD. By the end of the tutorial, we will have created a reusable parser for tabular data that can be integrated into a custom ELN schema.
What you will learn
In this tutorial, you will learn how to:
- Create a tabular parser section for a
.csvfile in a.archive.yamlschema file. - Configure the tabular parser to map data from a
.csvfile to schema quantities. - Create plots of the parsed data directly in the NOMAD.
- Integrate the tabular parser into a custom NOMAD ELN schema to attach measurement data to an ELN entry.
Before you begin
This tutorial builds on the previous tutorial create a custom ELN schema in NOMAD using YAML. Basic familiarity with defining sections and quantities in a .archive.yaml file is assumed.
Before starting, make sure you have:
-
NOMAD user account
Creating and editing ELN entries requires a NOMAD user account.
You can create an account by following the steps described in the overview page. -
Basic understanding of uploads and entries
Familiarity with uploads and entries, and how they relate to each other can be helpful. These concepts are introduced in the section key elements in NOMAD. -
Basic familiarity with YAML configuration files
This tutorial uses YAML to define the tabular parser. Prior experience with YAML syntax and indentation is helpful, but deep knowledge of YAML is not required. -
A YAML-capable editor or IDE (e.g., VS Code)
You will edit a YAML file during the tutorial. Using an editor or IDE with YAML support (for example, VS Code) is recommended.
About the measurement data used in this tutorial
In this tutorial, we use an example optical absorption spectrum of P3HT to demonstrate how tabular measurement data stored in .csv file can be parsed, structured, and visualized in a custom NOMAD ELN schema.
Download the example file P3HT_optical.csv
The file contains two columns:
Wavelength(in nanometers)Absorbance
Each row represents one measurement point of the optical spectrum.
You will configure the tabular parser to read these columns into array quantities (wavelength and absorbance) and visualize the spectrum directly in the ELN.
In the final optional step, you will integrate this optical absorption section into the polymer-processing ELN schema created in the previous tutorial.
Download the custom polymer-processing schema file polymer_processing.archive.yaml.
Step 1: Declare the schema package and add a parser section
Create a new file named optical_absorption.archive.yaml in a local working directory, then add the following content:
definitions:
  name: This is a parser for optical absorption data in the .csv format.
  sections:
    Optical_absorption:
-
definitions:declares a schema package and contains the metadata of your schema such as its name and the sections it contains. -
name:provides a human-readable identifier for the package. -
sections:introduces a block where individual sections are defined. Here, you define a section namedOptical_absorption, which will configure how the tabular data file is parsed and visualized.
Note that name: and sections: must be indented one level (two spaces) with respect to definitions:.
Step 2: Inherit the base sections for parsing and plotting
To ensure that the Optical_absorption section is treated as a valid NOMAD entry and supports tabular file parsing and visualization, inherit from the appropriate base sections using base_sections:.
Add the following content to the schema file:
      base_sections:
        - nomad.datamodel.data.EntryData
        - nomad.parsing.tabular.TableData
        - nomad.datamodel.metainfo.plot.PlotSection
Where to paste: under Optical_absorption: and indented one level (two spaces) with respect to it.
Checkpoint 1
Your file so far (after step 2) should look like the following:
Step 3: Add the quantities to the parser section
Now define the quantities required for the tabular parser section:
You will define:
data_fileto store the uploaded.csvfile.wavelengthto store x-axis values extracted from the file.absorbanceto store y-axis values extracted from the file.
Add the following content to the schema file:
quantities:
data_file:
type: str
wavelength:
type: np.float64
unit: nm
shape: ['*']
absorbance:
type: np.float64
shape: ['*']
Where to paste: under Optical_absorption: and indented one level (two spaces) with respect to it, i.e., quantities aligns with base_sections:.
- Since
wavelengthandabsorbancecontain multiple data points, define them as arrays usingshape: ['*']. - If a quantity represents a physical value, you can also provide a
unit(here:nmforwavelength).
Checkpoint 2
Your file so far (after step 2) should look like the following:
definitions:
  name: This is a parser for optical absorption data in the .csv format.
  sections:
    Optical_absorption:
      base_sections:
        - nomad.datamodel.data.EntryData
        - nomad.parsing.tabular.TableData
        - nomad.datamodel.metainfo.plot.PlotSection
      quantities:
        data_file:
          type: str
        wavelength:
          type: np.float64
          unit: nm
          shape: ['*']
        absorbance:
          type: np.float64
          shape: ['*']
Step 4: Configure how NOMAD handles the quantities
In Step 3, you defined the required quantities for the tabular parser. Now you add an m_annotations: block to each quantity, so that NOMAD knows how to handle it correctly in the GUI and during parsing.
The data_file quantity
Configure the data_file quantity using three annotations so that:
- It accepts files as input, either via drag-and-drop or the file selection browser via the
elnannotation. - It supports file actions in the GUI like previewing or downloading the raw file via the
browserannotation. - The tabular parser is automatically applied to extract data from the attached file via the
tabular_parserannotation.
Add the following content to the schema file:
          m_annotations:
            eln:
              component: FileEditQuantity
            browser:
              adaptor: RawFileAdaptor
            tabular_parser:
              parsing_options:
                comment: '#'
                skiprows: [1]
              mapping_options:
                - mapping_mode: column
                  file_mode: current_entry
                  sections:
                    - '#root'
Where to paste: under data_file and indented one level (two spaces) with respect to it, i.e., m_annotations: aligns with type:.
component: FileEditQuantityunder theelnannotation enables the file upload function in NOMAD.adaptor: RawFileAdaptorunder thebrowserannotation enables file actions in the GUI, e.g., file preview and download.parsing_options:under thetabular_parserannotation defines how the raw file is read before its contents are mapped to schema quantities.comment: '#'ignores commented lines in the file.skiprows: [1]skips the second row (row index1), which contains the units, so the remaining rows can be parsed as numeric values.
mapping_options:under thetabular_parserannotation defines how the parsed table data are written into your schema.mapping_mode: columnmaps each column of the file to the corresponding schema quantities.file_mode: current_entryprocesses the parsed data into the same NOMAD entry instead of creating a new one.sections: ['#root']specifies that the mapped quantities are filled into the root section of the entry (here, theOptical_absorptionsection).
The wavelength quantity
This quantity will be filled with values extracted from the column whose header is Wavelength.
Add a tabular annotation under wavelength so NOMAD knows which column to map into this quantity:
Where to paste: inside your wavelength: quantity block, aligned with type:.
name: under the tabular annotation specifies the header of the column that should be mapped to this quantity.
The absorbance quantity
This quantity will be filled with values extracted from the column whose header is Absorbance.
Add a tabular annotation under absorbance quantity:
Where to paste: inside your absorbance: quantity block, aligned with type:.
Use the exact column header
The value of the name: key (under the tabular: annotation) must exactly match the column header in the .csv file, including spelling and capitalization.
If the header does not match, the column will not be mapped to the quantity.
Checkpoint 3
Your file so far (after step 4) should look like the following:
definitions:
name: This is a parser for optical absorption data in the .csv format.
sections:
Optical_absorption:
base_sections:
- nomad.datamodel.data.EntryData
- nomad.parsing.tabular.TableData
- nomad.datamodel.metainfo.plot.PlotSection
quantities:
data_file:
type: str
m_annotations:
eln:
component: FileEditQuantity
browser:
adaptor: RawFileAdaptor
tabular_parser:
parsing_options:
comment: '#'
skiprows: [1]
mapping_options:
- mapping_mode: column
file_mode: current_entry
sections:
- '#root'
wavelength:
type: np.float64
unit: nm
shape: ['*']
          m_annotations:
            tabular:
              name: Wavelength
absorbance:
type: np.float64
shape: ['*']
          m_annotations:
            tabular:
              name: Absorbance
Step 5: Create a plot for the data
So far, you have defined how the tabular data are parsed and mapped to schema quantities.
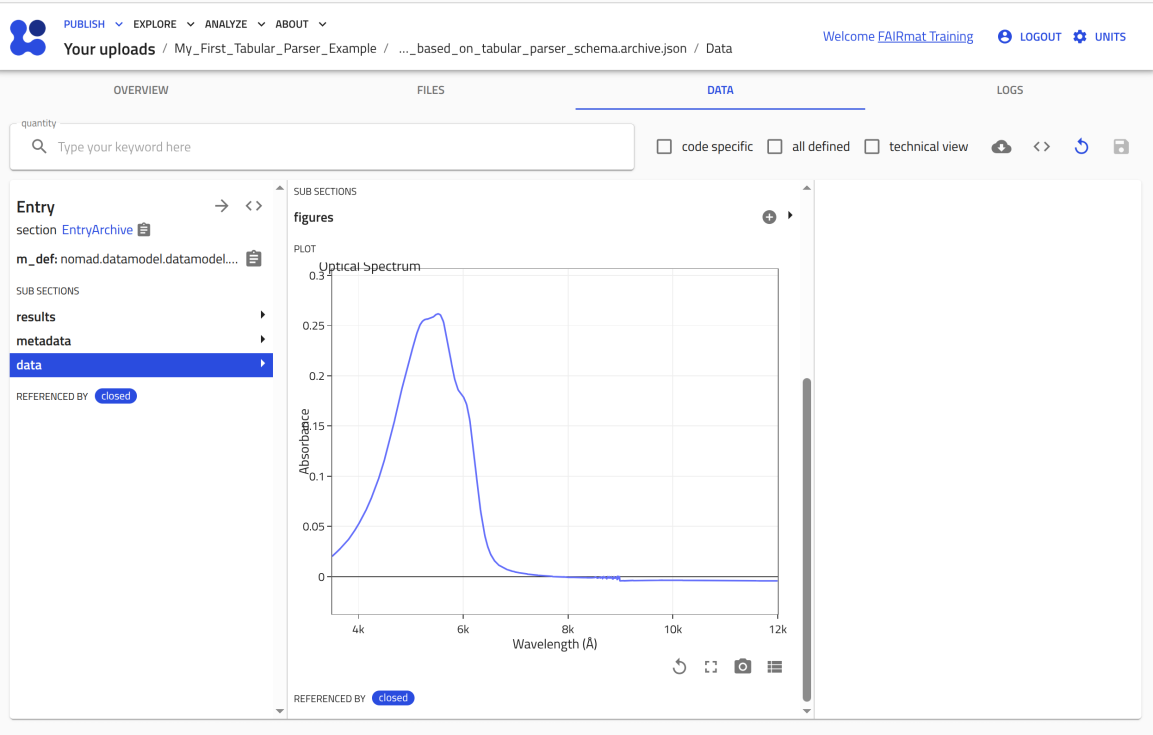
In this step, you will configure how these quantities are visualized in the NOMAD ELN by adding a plotly_graph_object annotation to the Optical_absorption section.
Add the following content to the schema file:
m_annotations:
plotly_graph_object:
data:
x: "#wavelength"
y: "#absorbance"
layout:
title: Optical Spectrum
Where to paste: inside your Optical_absorption: section definition and indented one level (two spaces) with respect to it, i.e., m_annotations: alignes with base_sections: and quantities:.
plotly_graph_object:annotation enables plotting for this section.data:defines the quantities used for the axes.x: "#wavelength"sets the horizontal axis.y: "#absorbance"sets the vertical axis.- Values prefixed with
#reference quantities defined in this section.
layout:defines the plot appearance.title:sets the title which is displayed above the plot.
Checkpoint 4 (complete tabular parser)
This is the complete optical_absorption.archive.yaml file up to this point. Use it as a checkpoint to compare against your file.
definitions:
  name: This is a parser for optical absorption data in the .csv format.
  sections:
    Optical_absorption:
      base_sections:
        - nomad.datamodel.data.EntryData
        - nomad.parsing.tabular.TableData
        - nomad.datamodel.metainfo.plot.PlotSection
      quantities:
        data_file:
          type: str
          m_annotations:
            eln:
              component: FileEditQuantity
            browser:
              adaptor: RawFileAdaptor
            tabular_parser:
              parsing_options:
                comment: '#'
                skiprows: [1]
              mapping_options:
                - mapping_mode: column
                  file_mode: current_entry
                  sections:
                    - '#root'
        wavelength:
          type: np.float64
          unit: nm
          shape: ['*']
          m_annotations:
            tabular:
              name: Wavelength
        absorbance:
          type: np.float64
          shape: ['*']
          m_annotations:
            tabular:
              name: Absorbance
      m_annotations:
        plotly_graph_object:
          data:
            x: "#wavelength"
            y: "#absorbance"
          layout:
            title: Optical Spectrum
How to read it: this .archive.yaml file defines a schema package under definitions. The package has a name and defines one main section called Optical_absorption under sections: keyword. The Optical_absorption section uses nomad.datamodel.data.EntryData to make an entry, nomad.parsing.tabular.TableData to be able to read the tabular data files, and nomad.datamodel.metainfo.plot.PlotSection to prepare a plot. It defines three quantities data_file, wavelength, and absorbance with proper shape and type, and uses m_annotations: to configure file upload, parsing, and to plot absorbance versus wavelength.
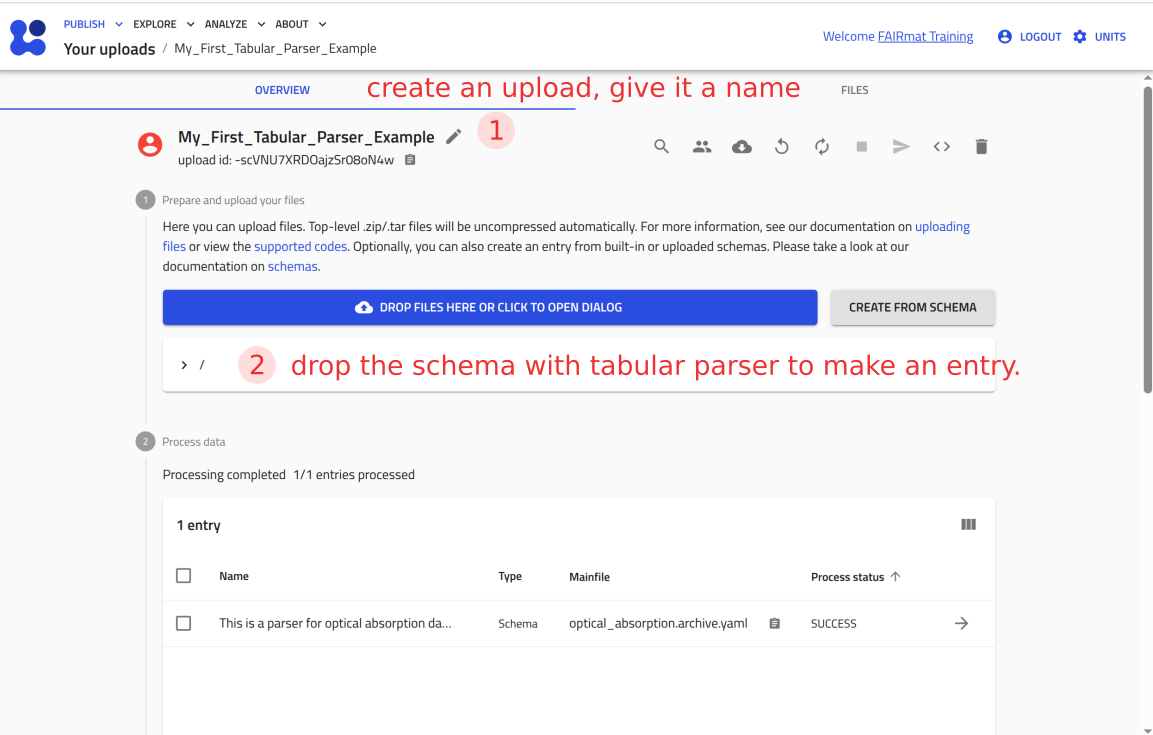
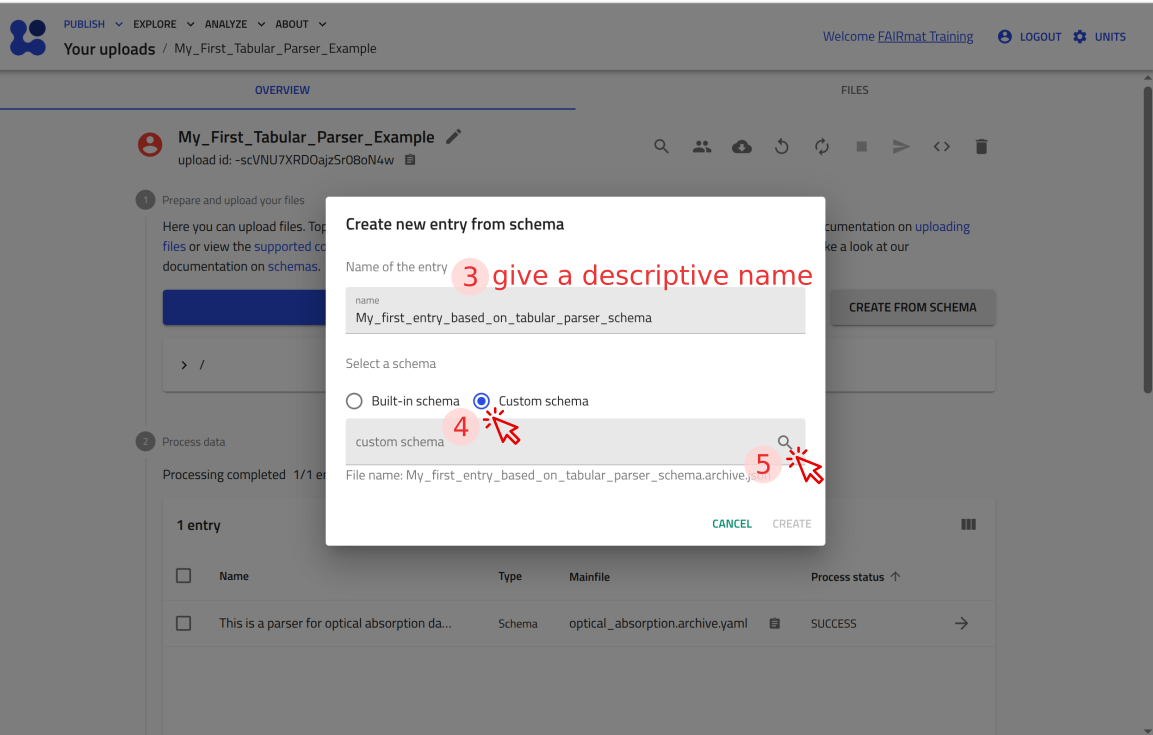
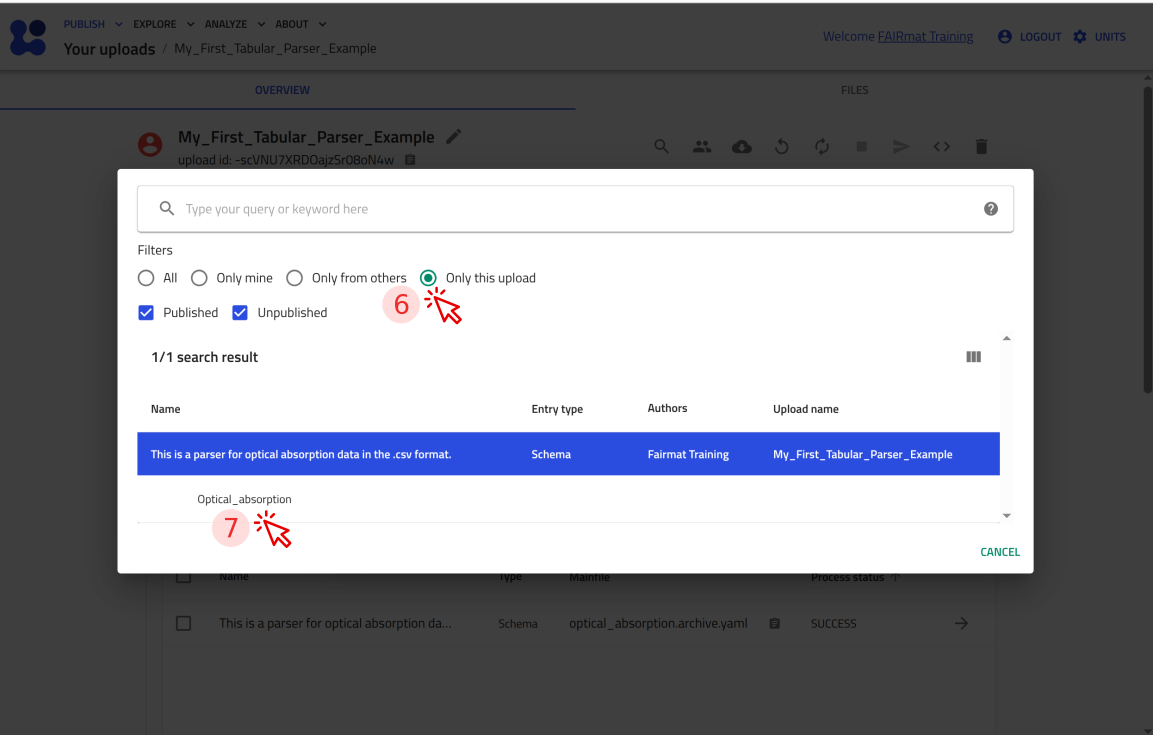
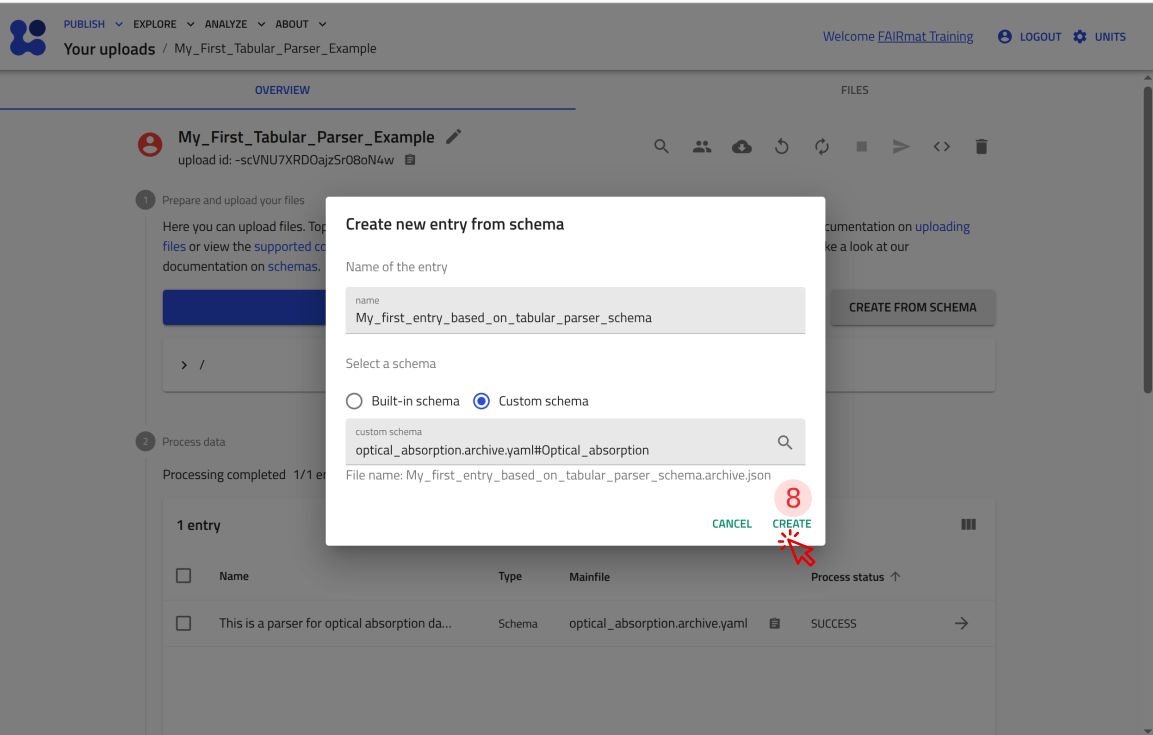
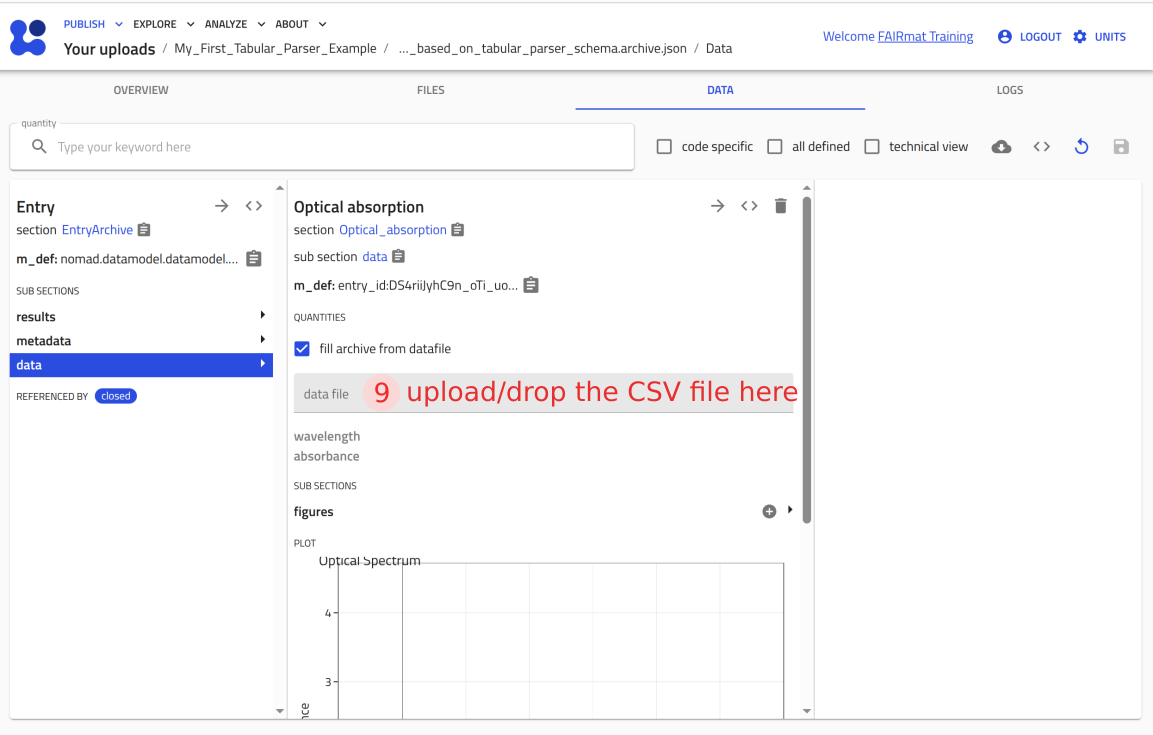
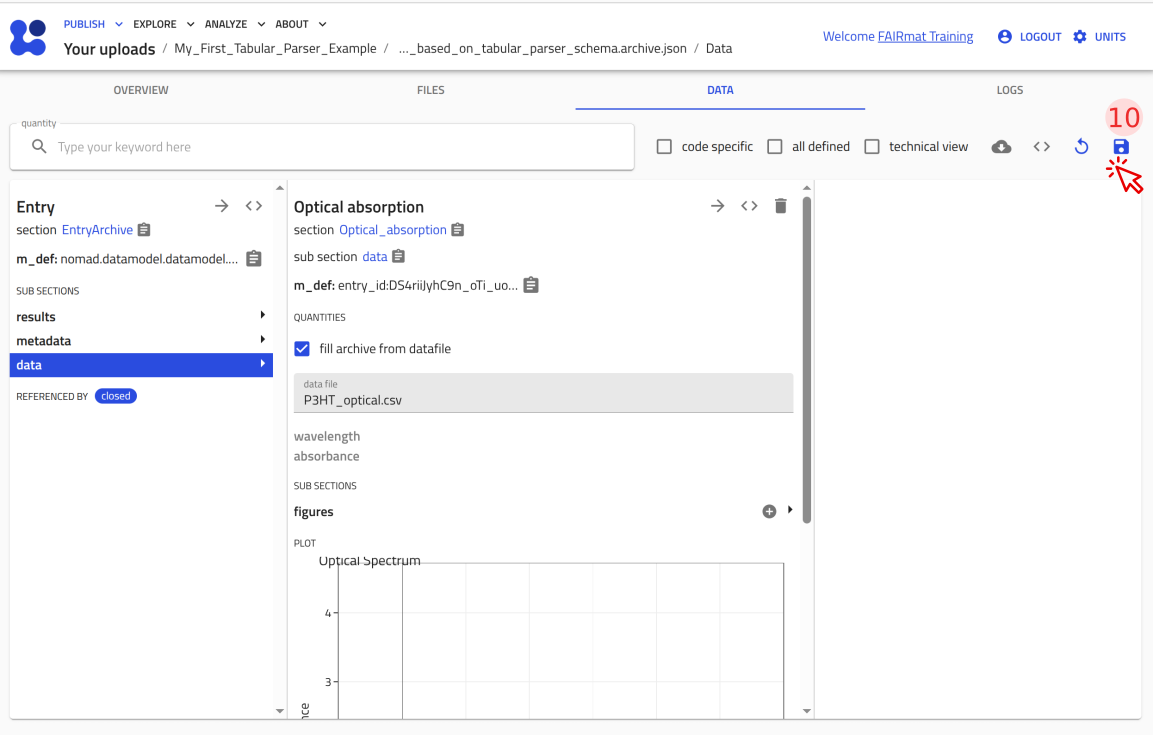
Step 6: Test your tabular parser in NOMAD
You can now upload this file to NOMAD and verify that it creates an entry where you can attach P3HT_optical.csv and see the plot.
Use the arrow buttons ⬅️➡️ below to follow the steps for uploading the schema and creating a test entry.
Step 7: Integrate the tabular parser section into an ELN template
So far, you have created a standalone schema section for parsing and visualizing optical absorption data.
In this step, you will reuse this section inside the polymer-processing ELN schema created in the previous tutorial.
This allows you to upload an optical absorption file and visualize the spectrum directly within the same ELN entry.
Task
Add the Optical_absorption section as a subsection in the polymer_processing.archive.yaml custom ELN schema.
Ensure that:
Optical_absorption:appears inside thesub_sections:block ofExperiment_Information.- Its indentation level matches that of
Sample,Solution, andPreparation.
Solution
In your polymer_processing.archive.yaml, add an Optical_absorption subsection under Experiment_Information and give it the same section definition you built in this tutorial (the one that includes TableData and PlotSection).
The complete example below shows one possible result, where Optical_absorption is added at the same level as Sample, Solution, and Preparation.
definitions:
  name: Processing of polymers thin-films
  sections:
    Experiment_Information:
      base_sections:
        - nomad.datamodel.data.EntryData
      quantities:
        Name:
          type: str
          default: Experiment title
          m_annotations:
            eln:
              component: StringEditQuantity
        Researcher:
          type: str
          default: Name of the researcher who performed the experiment
          m_annotations:
            eln:
              component: StringEditQuantity
        Date:
          type: Datetime
          m_annotations:
            eln:
              component: DateTimeEditQuantity
        Additional_Notes:
          type: str
          m_annotations:
            eln:
              component: RichTextEditQuantity
      sub_sections:
        Sample:
          section:
            base_sections:
              - nomad.datamodel.metainfo.eln.ELNSample
            m_annotations:
              eln:
                overview: true
                hide: ['chemical_formula']
        Solution:
          section:
            base_sections:
              - nomad.datamodel.metainfo.eln.ELNSample
            m_annotations:
              eln:
                overview: true
                hide: ['chemical_formula', 'description']
            quantities:
              Concentration:
                type: np.float64
                unit: mg/ml
                m_annotations:
                  eln:
                    component: NumberEditQuantity
            sub_sections:
              Solute:
                section:
                  quantities:
                    Substance:
                      type: nomad.datamodel.metainfo.eln.ELNSubstance
                      m_annotations:
                        eln:
                          component: ReferenceEditQuantity
                    Mass:
                      type: np.float64
                      unit: kilogram
                      m_annotations:
                        eln:
                          component: NumberEditQuantity
                          defaultDisplayUnit: milligram
              Solvent:
                section:
                  quantities:
                    Substance:
                      type: nomad.datamodel.metainfo.eln.ELNSubstance
                      m_annotations:
                        eln:
                          component: ReferenceEditQuantity
                    Volume:
                      type: np.float64
                      unit: meter ** 3
                      m_annotations:
                        eln:
                          component: NumberEditQuantity
                          defaultDisplayUnit: milliliter
        Preparation:
          section:
            base_sections:
              - nomad.datamodel.metainfo.eln.Process
            m_annotations:
              eln:
                overview: true
        Optical_absorption:
          section:
            base_sections:
              - nomad.datamodel.data.EntryData
              - nomad.parsing.tabular.TableData
              - nomad.datamodel.metainfo.plot.PlotSection
            quantities:
              info_about_data:
                type: str
                m_annotations:
                  eln:
                    component: RichTextEditQuantity
              data_file:
                type: str
                m_annotations:
                  eln:
                    component: FileEditQuantity
                  browser:
                    adaptor: RawFileAdaptor
                  tabular_parser:
                    parsing_options:
                      comment: '#'
                      skiprows: [1]
                    mapping_options:
                      - mapping_mode: column
                        file_mode: current_entry
                        sections:
                          - '#root'
              wavelength:
                type: np.float64
                unit: nm
                shape: ['*']
                m_annotations:
                  tabular:
                    name: Wavelength
              absorbance:
                type: np.float64
                shape: ['*']
                m_annotations:
                  tabular:
                    name: Absorbance
            m_annotations:
              plotly_graph_object:
                data:
                  x: "#wavelength"
                  y: "#absorbance"
                layout:
                  title: Optical Spectrum