Data processing with CasaXPS
pynxtools-xps supports extracting data and the description of the data analysis (i.e., peak fitting)
by the CasaXPS data analysis software.
Modeling of peak fitting in CasaXPS
This is a short description of how peak models are implemented in CasaXPS. The user is referred to the CasaXPS web site for a more accurate and detailed explanation.
CasaXPS models peak fitting using two concepts: regions and components. Regions define the energy range that is used for peak fitting as well as the background shape to be used. Many different background shapes are available in CasaXPS, including the most commonly used linear, Shirley, and Tougaard backgrounds. Each peak model is made up of several components, each of which model a single chemical species. Components can have many different line shapes. Constraints with respect to the total area, full-width at half maximum, and position on the energy axis can be defined as well, also with respect to any of the other components.
Modeling of data fitting in NeXus
NeXus contains a base class for modelling fit procedures called NXfit. NXfit contains
- the data to be modelled
- one or more instances of
NXpeakto define individual peaks in the model. These map to the components in CasaXPS - one or more instances of
NXpeakto define the background to be subtracted during the fit. These map to the regions in CasaXPS. - two instances of
NXfit_functionto describe the function used for the global fit (global_fit_function) and for the optimization (error_function). - information about the fitting sum (envelope) and the residual of the fit
The application definition NXxps implements an NXfit group to model peak fitting in XPS. Aside from the terms defined in the base class NXfit, it also contains some information more specific to XPS fits, like the atomic concentration of each species in the fit model.
How-to convert peak fitting in CasaXPS into a NeXus file
pynxtools-xps can extract the definition of the peak fitting parameters and store them in an HDF5 file compliant with the NXxps application definition.
Three files are needed for the example conversion:
- The VAMAS (.vms) file containing the original (meta)data and the definition of the peak fitting in the VAMAS comments
- The lineshapes of the measurement data as well as the peak fitting, exported from CasaXPS as a TXT file.
This file can be obtained by using the
Save Tab ASCIIto TXT button in CasaXPS and choosing "Rows of Tables" as the export option. - The analysis results (incl. the atomic concentrations), exported from CasaXPS as a CSV file. This file can be obtained from the
Quantifywindow in CasaXPS, by exporting the "Comps" report from the "Report" tab as a CSV file. Note that for this to work, you need to change to "Edit Mode" in CasaXPS, so that the entry names are correctly stored in that file.
Learn more about XPS quantification in CasaXPS in the CasaXPS documentation.
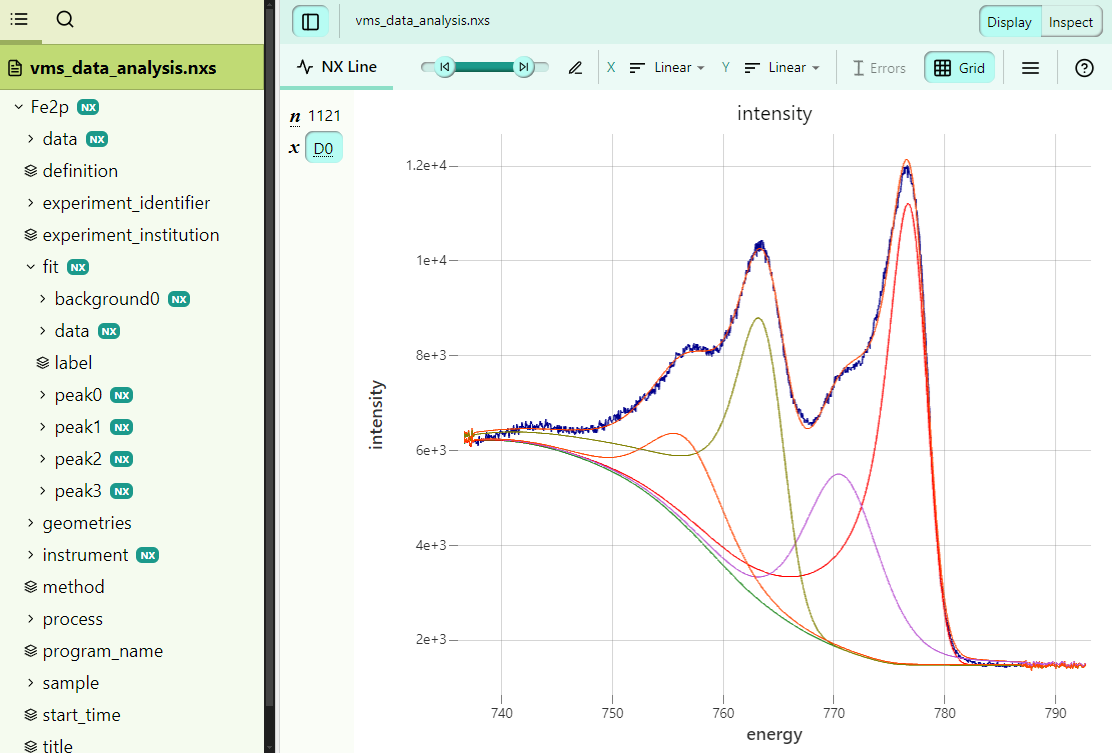
Example conversion
See Reference > VAMAS ISO standard > Data analysis and peak fitting for an example of converting VAMAS data containing data analysis results from CasaXPS. The resulting file looks like this: